
TL;DR
- What it is: Risk modeling in lending uses statistical and machine learning methods to estimate the likelihood and cost of a borrower defaulting, combined into Expected Loss (PD x LGD x EAD).
- The core mechanic: Models learn from historical data and apply those patterns to new applicants or existing accounts, which means they are only as reliable as history’s resemblance to what comes next.
- Who it applies to: Application scorecards (new borrowers) and behavior scorecards (existing customers), built with methods ranging from logistic regression to machine learning.
- Key dates / terms: The RBI’s 24 June 2026 draft model risk guidance names this exact failure pattern “time-suitability,” one of three sources of model risk.
- One caveat: This RBI guidance is a draft under public consultation, not final law, and the industry failure modes described here come from general practitioner sources, not RBI-specific rulings.
A model can post a strong AUC, pass its backtest, and clear every validation check a team runs on it, and still get the next year wrong. The math was never broken. What broke was the world the model assumed would hold.
A Risk Model Can Pass Every Backtest and Still Be Wrong
Risk modeling in lending is the practice of using statistical and machine learning methods to estimate the likelihood and cost of a borrower defaulting, so a lender can price, approve, or decline credit with a number instead of a guess. It works by learning patterns from historical borrower data and applying them to new applicants or existing accounts.
That last part is the whole problem. A model trained on history is only as good as history’s resemblance to what comes next. A scorecard that performed well through a stable credit cycle carries no guarantee about a cycle that turns.
What a Lending Risk Model Actually Calculates: PD, LGD, and EAD
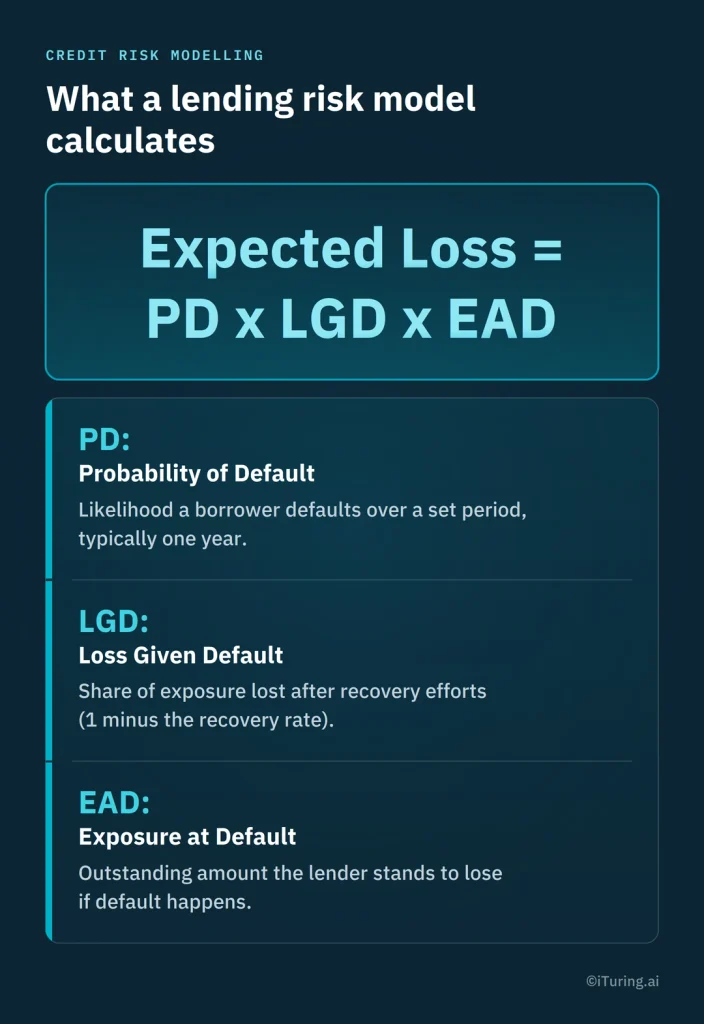
Most lending risk models come down to three numbers, combined into one: Expected Loss equals Probability of Default multiplied by Loss Given Default multiplied by Exposure at Default.
Probability of Default (PD) is the likelihood that a given borrower defaults over a set period, typically one year. Exposure at Default (EAD) is the outstanding amount the lender stands to lose if that default happens. Loss Given Default (LGD) is the share of that exposure the lender actually loses after recovery efforts, calculated as one minus the recovery rate.
A model that gets any one of these three wrong gets the price of risk wrong. A PD model that underestimates default likelihood in a new segment prices loans too cheaply for the risk they actually carry. An LGD model that assumes recovery rates from a benign period overstates how much a lender will get back when conditions worsen.
Application Scorecards, Behavior Scorecards, and the Methods Behind Them
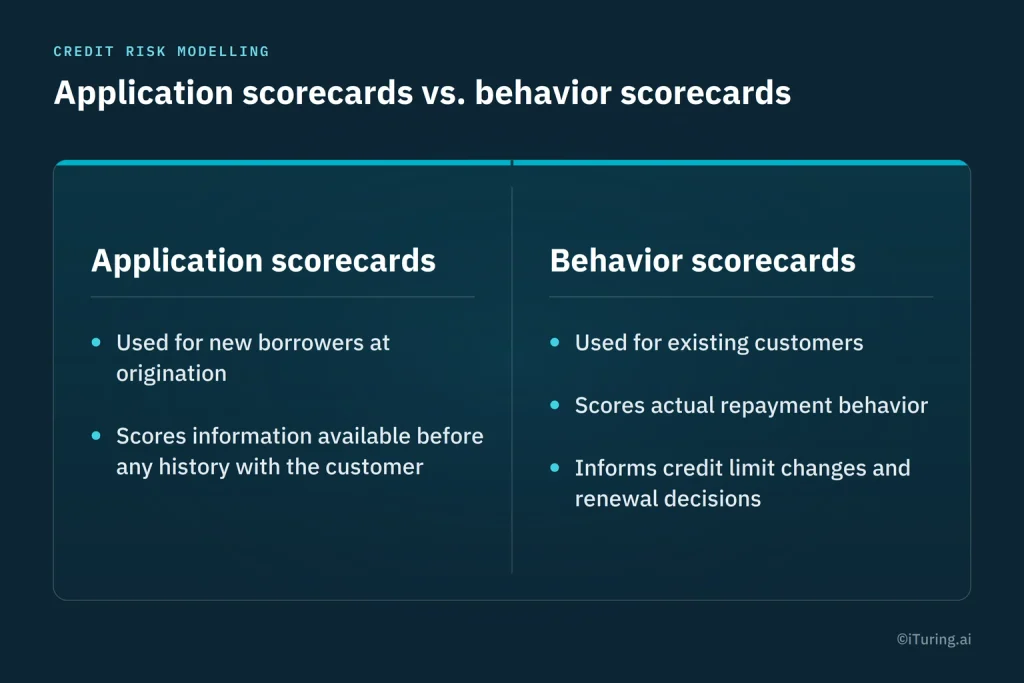
Lending risk models split into two main types by when they’re used. Application scorecards assess new borrowers at the point of origination, using the information available before the lender has any history with them. Behavior scorecards evaluate existing customers, using their actual repayment behavior to inform credit limit changes and renewal decisions. Collections scoring and desertion scoring extend the same logic to later stages of the relationship.
The statistical methods behind these scorecards range from simple to complex. Logistic regression remains the most widely used technique because it is transparent and its outputs are easy to explain to a credit committee or a regulator. Survival analysis models how long it takes a borrower to default, rather than just whether they will. More complex methods, including random forest, gradient boosting, and neural networks, can capture patterns simpler models miss, at the cost of being harder to explain.
That tradeoff between accuracy and explainability is not academic. A model a bank cannot explain to an examiner is a model that creates a different kind of risk, even when its predictions are sound.
Five Ways a Risk Model Fails Without Anyone Noticing at First
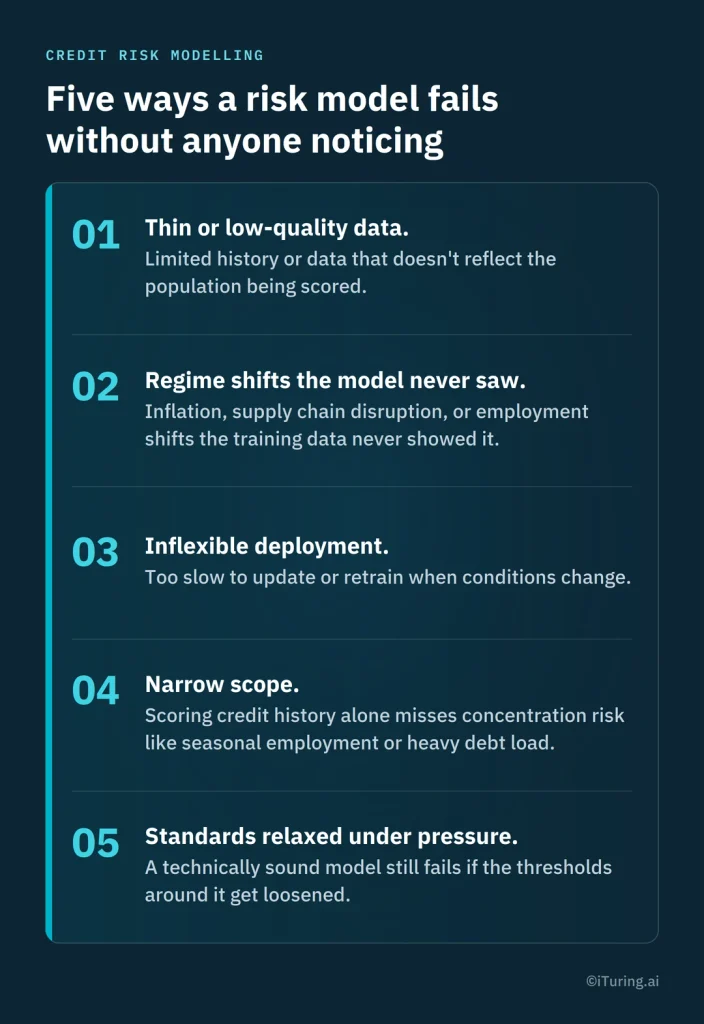
Credit risk models rarely fail with a dramatic error message. They fail quietly, by getting steadily less accurate while still producing confident-looking numbers.
Thin or low-quality data. A model built on a limited history, or on data that doesn’t reflect the population it will actually score, starts wrong. This is common with new lending products or newly targeted segments where the institution simply doesn’t have years of outcomes to learn from yet.
Regime shifts the model never saw. A model trained during a stable economic period has no experience of what happens when it isn’t stable. Inflation spikes, supply chain disruption, or a sudden shift in employment patterns can all move default behavior in ways the training data never showed the model.
Inflexible deployment. A model that takes months to update or retrain cannot respond when conditions change quickly. By the time a slow-moving institution adjusts its lending policy, the exposure has already been written.
Narrow scope. A model that scores credit history alone, without looking at a borrower’s whole financial picture, misses concentration risk. Seasonal employment or an already heavy debt load can sink a borrower a narrow model rated as safe.
Standards relaxed under pressure. The clearest historical example is 2008, when loans were extended to borrowers who could not realistically afford them, sold on, and the resulting defaults contributed to a global recession. A model can be technically sound and still fail if the thresholds built around it get loosened.
None of these failure modes shows up as a broken model on a dashboard. They show up as a model that is quietly, increasingly wrong.
Why “Time-Suitability” Is the RBI Draft’s Name for This Problem
The Reserve Bank of India’s Draft Guidance on Regulatory Principles for Model Risk Management, released 24 June 2026, names exactly this pattern as one of three sources of model risk: time-suitability, where a model becomes less fit for purpose as conditions change, even though nothing about the model itself has broken.
This RBI guidance is a draft under public consultation, not yet in force, with comments closed 24 July 2026. But the pattern it describes doesn’t wait for a final rule to be true. A model degrading from regime shifts or thin data is a time-suitability failure whether or not a regulation has a name for it yet.
Catching it requires the discipline covered in model validation: independent testing that checks a model’s outcomes against reality on a schedule, rather than trusting a model because it passed once at launch.
Building Risk Models That Show Their Failure Before It Reaches the Book
A risk model that fails quietly is dangerous specifically because nobody sees it happening. The fix isn’t a better model. It’s a model built inside a system that surfaces decay before it turns into losses.
A governed platform does this by keeping every prediction traceable to an explanation, so a drop in accuracy shows up as a specific, diagnosable shift rather than a mystery. Every model change runs through maker-checker approval, and continuous monitoring checks live performance against expectations instead of waiting for the next scheduled review. The full lineage from data to decision sits in an immutable audit trail, so when a model starts drifting, the cause is visible immediately rather than reconstructed after the fact.
A leading NBFC in India used this approach to rank borrowers by risk and focus collections on the highest-risk segment, seeing a 116% improvement in collections and 86% predictive accuracy, deployed in two weeks. The model’s accuracy was not an accident. It came from a system built to show exactly where a model’s predictions held and where they didn’t.
If your team is scoping how to catch model decay before it reaches the book, book a working session with our data science team to review your current risk modeling setup against the failure modes above.
This risk modeling discussion sits inside the wider model risk management framework, which covers the governance, inventory, and oversight that catch these failures across an institution’s entire model portfolio, not just one model at a time.