






A Model Calibrated on US or UK Repayment Behaviour Is Answering a Question SA Borrowers Aren’t Actually Being Asked
TL;DR
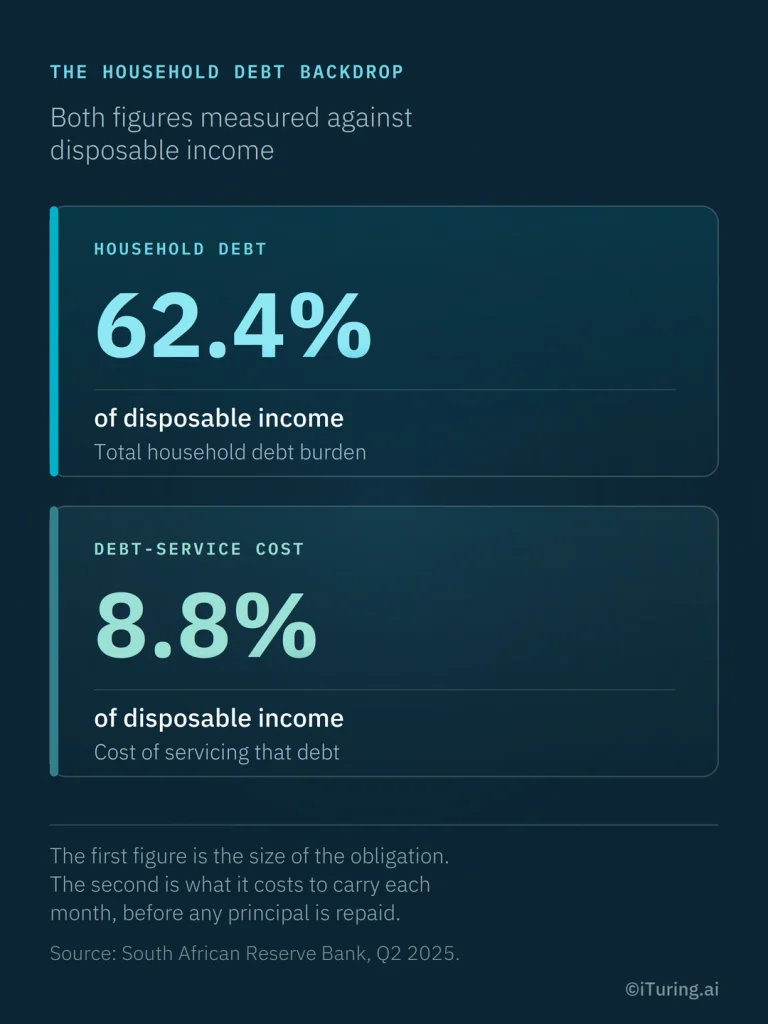
- South African household debt stood at 62.4% of nominal disposable income by Q2 2025, with debt-service costs absorbing 8.8% of disposable income, per SARB data, a meaningful and sustained strain on repayment capacity
- The unsecured credit market, which includes personal loans, stood at R211.62 billion in outstanding debt as of Q1 2025 per NCR figures, a significant share of household borrowing even with a modest year-on-year decline
- A collections model built on international behavioural data is calibrated to different income patterns, payment rails, and economic conditions than what actually drives SA borrower behaviour
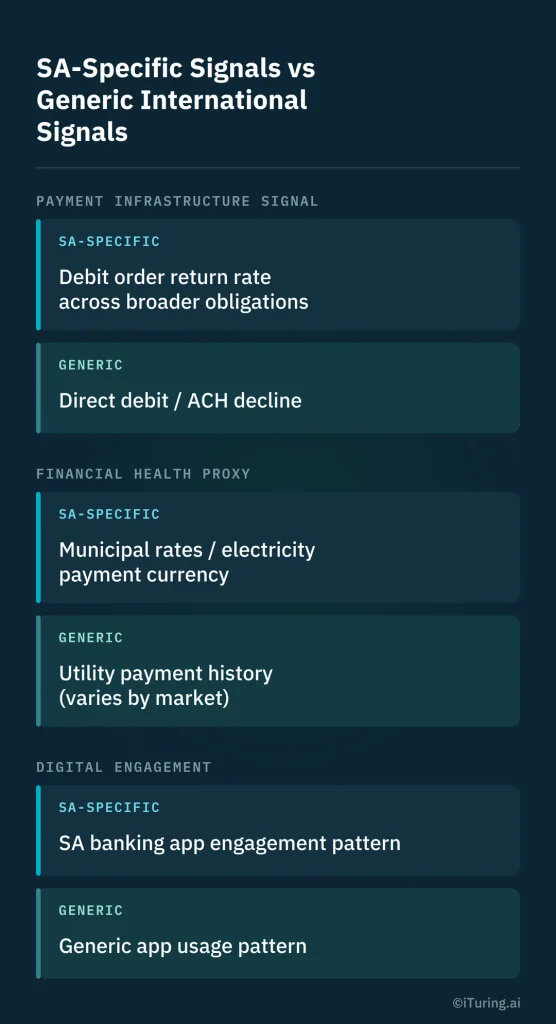
- Salary credit patterns, debit order return rates, and mobile banking activity are SA-specific signals that reflect local repayment realities, including debit order infrastructure that behaves differently from direct debit systems elsewhere
- Municipal payment behaviour, whether a borrower is current on rates, electricity, and other municipal accounts, offers an SA-specific proxy for broader financial health that has no direct equivalent in markets without this specific payment structure
- Recovery benchmarks and cost-per-recovery figures need to be built and expressed in rand from local data, not extrapolated from international benchmarks that reflect a different cost and behavioural environment entirely
South African households are carrying meaningful debt pressure right now: household debt sat at 62.4% of disposable income by mid-2025, with debt-service costs consuming close to 9% of what households actually have available to spend. Against that backdrop, a personal loan collections model built on behavioural assumptions imported from the US or UK market isn’t just imprecise, it’s calibrated to a repayment environment that doesn’t match what’s actually driving SA borrower behaviour on the ground.
Why Imported Collections Models Underperform in South Africa
The unsecured credit market in South Africa, which includes personal loans, represented R211.62 billion in outstanding debt as of the first quarter of 2025, a meaningful share of household borrowing even amid a modest year-on-year decline. A collections model built on international data was calibrated against a different set of income patterns, a different payment infrastructure, and different economic pressures entirely, and simply deploying that model against SA borrower data misses the local signals that actually predict repayment behaviour here.
Salary Credit Patterns and Debit Order Return Rates as SA-Specific Signals
Salary credit timing and consistency remain a strong signal in any market, but debit order return rates carry particular weight in South Africa given how central debit order infrastructure is to how South African consumers manage recurring payments. A rising pattern of debit order returns, technically declined or reversed debit order attempts, across a borrower’s broader financial obligations, not just the loan in question, is an SA-specific early signal of broader financial strain that a model built around a different payment rail, such as ACH or direct debit systems structured differently elsewhere, simply won’t have learned to read.
Mobile Banking Activity and Municipal Payment Behaviour
Mobile banking engagement patterns offer a real-time view into a borrower’s financial activity, similar in principle to app engagement signals used elsewhere, but calibrated to South African banking app usage patterns specifically. Municipal payment behaviour, whether rates, electricity, and other municipal account payments remain current, offers a distinctly South African proxy for broader financial health: municipal billing and payment enforcement operate differently here than in markets without an equivalent structure, making this a genuinely local signal with no direct import equivalent.
Building Recovery Benchmarks in Rand, Not Extrapolated Data
Recovery cost and benchmark figures need to be built from South African data and expressed in rand terms directly, reflecting the actual local cost of contact, local agent economics, and the specific repayment behaviour patterns described above. An extrapolated benchmark, taking a US or UK figure and converting it at an exchange rate, carries forward all of the calibration mismatch already discussed and adds a currency conversion assumption on top of it. Local recovery benchmarks, sourced from SA-specific portfolio data, are the only defensible basis for setting collections cost and effort allocation decisions.
Where iTuring Fits
iTuring’s Data Accelerator and AutoML+ modules build SA-specific feature families, debit order return pattern history, mobile banking engagement calibrated to local app usage, and municipal payment behaviour, directly into personal loan collections scoring, rather than requiring these signals to be reverse-engineered onto an imported model built for a different market’s repayment infrastructure.
Sources
- National Credit Regulator, unsecured credit market outstanding debt figures, Q1 2025
- South African Reserve Bank, household debt-to-disposable-income and debt-service cost ratio, Q2 2025
- Current SA-specific debit order return rate and municipal payment behaviour benchmarks (source at time of publication, verify against current portfolio-level data)