TL;DR
- 14.7% of South African consumers were more than 3 months behind on at least one credit obligation in Q4 2025 — collections volume has increased materially without proportionate capacity growth
- SA manual collections average R380-520 per recovery; AI-first deployments reduce this to R180-240 — a 44-53% reduction at the same recovery output
- NCA compliance overhead adds 18-22% to SA manual collections operations cost; AI platforms pre-configure debt review integration, POPIA consent, and Section 129 tracking at no incremental cost
- Rising SA default rates accelerate AI collections payback in two ways: more accounts to contact increases the scale at which cost reduction generates savings, and rising NCR enforcement intensity increases compliance cost avoidance value
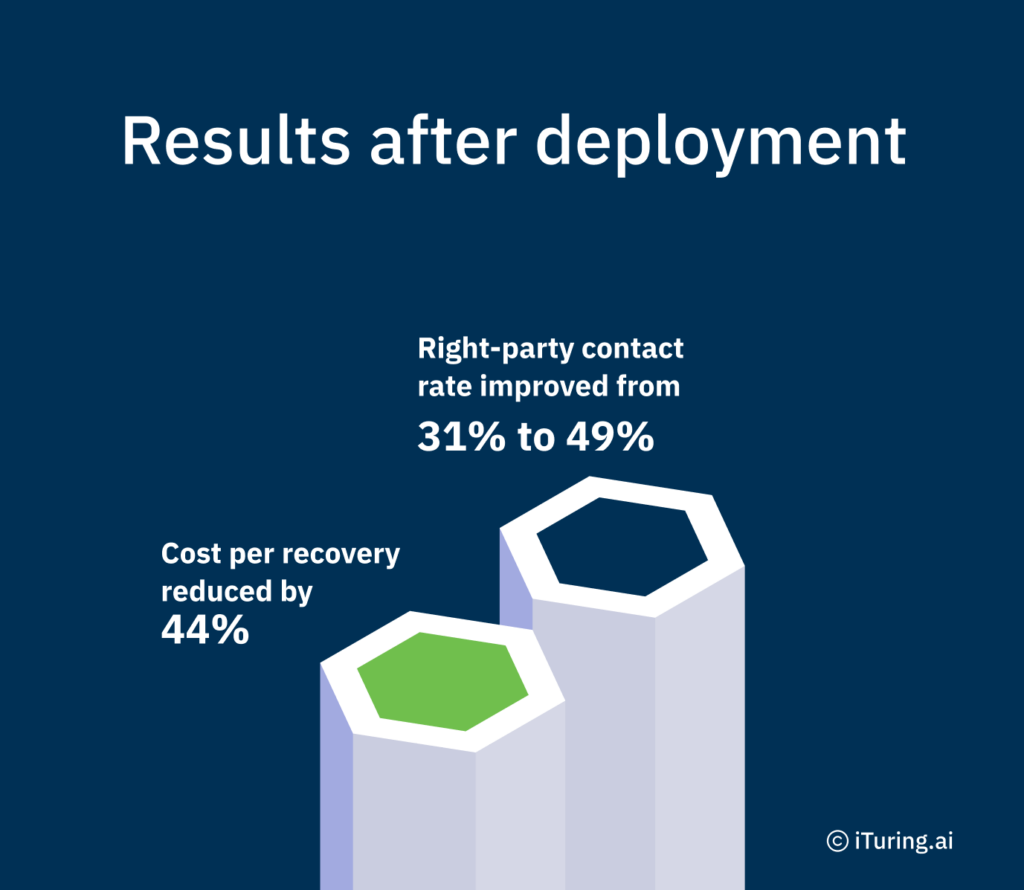
- iTuring SA deployments: right-party contact improved from 31% to 49%, cost per recovery reduced by 44%, NCA and POPIA controls pre-configured on deployment
South African credit providers entered 2026 facing a default environment that has not been this severe since the early pandemic quarters. The combination of persistent consumer over-indebtedness, elevated interest rates, and rising non-performing loan ratios has placed extraordinary pressure on collections operations. For Heads of Collections and their CFOs, the question is no longer whether to invest in AI-native collections infrastructure but whether the current cost-per-recovery baseline can survive another twelve months of volume growth without proportionate capacity expansion. The data from Q4 2025 and early 2026 makes the economics unavoidable: manual collections processes that cost R380-520 per recovery cannot sustain portfolio health when delinquency rates keep climbing. This article presents the specific benchmarks, cost comparisons, and deployment evidence that collections leaders need to build a credible internal business case. South African household debt remains elevated relative to nominal GDP, and the downstream effect on collections teams is measurable and accelerating.
What 14.7% Consumer Delinquency Means for SA Credit Provider Collections Capacity
The R420 per recovery figure that most South African credit providers carry as their manual collections baseline reflects a specific set of cost drivers. Agent salaries, telephony infrastructure, skip tracing, NCA-mandated Section 129 notice generation, and POPIA consent management all contribute to this number. The SA credit provider collections benchmark for 2025 shows that the bulk of this cost sits in agent talk time and compliance documentation, not in technology. For every successful recovery, a manual operation requires between four and seven contact attempts, each carrying its own cost regardless of outcome.
This baseline persists because of a structural constraint: manual agent capacity does not scale linearly with portfolio volume. When default rates rise, the number of accounts entering collections queues increases, but headcount budgets do not expand at the same rate. The result is a widening gap between accounts requiring contact and agents available to make those contacts. Queue saturation forces collections managers to prioritize accounts by balance size alone, leaving smaller accounts untouched and compounding losses over time.
The gap between R420 per recovery and R195 per recovery represents real money at portfolio scale. Consider a mid-size unsecured lender with 40,000 accounts entering collections per quarter. At R420 per recovery, total collections operations cost reaches R16.8 million quarterly. At R195 per recovery, that same volume costs R7.8 million, a quarterly saving of R9 million. This arithmetic becomes urgent when you consider that 14.7% of South African consumers were more than 3 months behind on at least one credit obligation in Q4 2025, the highest rate since Q2 2020 (TransUnion SA Consumer Credit Pulse Q4 2025). The average NPL ratio for unsecured SA credit providers reached 11.2% in Q3 2024, up from 8.8% in Q3 2022, a 2.4 percentage point deterioration in two years (NCR Quarterly Statistics Q3 2024). The South Africa credit provider collections cost for 2025 is not a static number: it is a moving target driven by volume growth that manual operations cannot absorb.
Why the 2025-2026 SA Default Rate Environment Changes the AI Collections ROI Calculation
- Account prioritisation determines right-party contact rate, and right-party contact rate is the single largest driver of collections efficiency. In a manual operation, agents work through queues sorted by balance or days past due. An AI collections platform applies predictive scoring to rank accounts by propensity to pay, contactability, and optimal channel preference. For a credit provider with 50,000 delinquent accounts, shifting from static queue sorting to propensity-based prioritisation means agents spend their limited talk time on accounts most likely to resolve. The effect on right-party contact rate is direct: fewer wasted dials, more productive conversations. When the SA NPL ratio for collections is climbing as it is now, the volume of low-propensity accounts in the queue grows faster than the volume of high-propensity accounts, making prioritisation more valuable with each percentage point of default rate increase.
- Channel and timing selection drives cost per contact. A manual operation defaults to outbound voice calls during business hours, regardless of whether the consumer prefers WhatsApp, SMS, or email, and regardless of whether they are reachable at 10 a.m. or 7 p.m. AI collections platforms test and learn across channels and time windows, routing each account to the combination that produces the highest response rate at the lowest cost. For a credit provider running 200,000 outbound attempts per month, shifting even 30% of contacts from voice to WhatsApp reduces telephony cost while maintaining or improving response rates. The retail credit market is entering a new phase where consumer communication preferences are fragmenting, and collections operations that cannot match those preferences lose contact efficiency.
- Self-cure identification reduces total contact volume. Between 8% and 15% of accounts entering early-stage collections will self-cure without any outbound contact. A manual operation contacts all accounts in the queue because it lacks the predictive capability to identify which accounts will resolve independently. An AI platform scores self-cure probability and suppresses outbound contact for high-probability accounts, reducing total contact volume and freeing agent capacity for accounts that require intervention. For a credit provider processing 30,000 new delinquent accounts per month, suppressing 3,000 self-cure accounts removes R1.26 million in unnecessary contact costs quarterly.
- Compliance cost reduction affects total operations cost in ways that are often invisible in manual operations. NCA compliance overhead, including Section 129 notice tracking, debt review integration, POPIA consent management, and NCR reporting, adds 18-22% to SA manual collections operations cost. This overhead is labour-intensive: compliance officers review outbound communications, track notice delivery timelines, and prepare documentation for NCR audits. An AI collections platform pre-configures these controls, generating compliant communications, tracking notice delivery automatically, and producing audit-ready documentation without incremental headcount. As NCR enforcement intensity increases, the cost avoidance value of automated compliance grows proportionally.
SA Collections Cost Benchmarks in the 2025-2026 Default Environment: Manual vs AI-First
The benchmarks below reflect median outcomes from AI-first collections deployments across South African credit providers operating in unsecured lending, retail credit, and personal loan portfolios during 2024-2025. These credit providers ranged from mid-size lenders with 20,000 active collections accounts to larger portfolios exceeding 100,000 accounts. The primary variable driving cost reduction was right-party contact rate improvement, which directly reduced the number of attempts required per successful recovery. Against the backdrop of South Africa’s collections default rate trends in 2025-2026, these benchmarks represent what is achievable when AI-native infrastructure replaces manual agent-only operations. The comparison below shows the specific metrics across deployment cohorts.
| Metric | Before AI | With iTuring |
| Cost per recovery | R380-520 (manual) | R180-240 (AI-first) |
| Right-party contact rate | 28-34% | 45-52% |
| Multilingual outreach | English only | Zulu, Xhosa, Afrikaans, Sotho — AI-native |
| NCA compliance overhead | Manual — 18-22% of ops cost | Pre-configured — zero incremental cost |
| Model governance (FSCA/PA) | Manual documentation | Auto-generated per validation cycle |
Results vary by portfolio composition, starting baseline, and data maturity: figures above reflect median outcomes across credit provider deployments.
Building the R195 Per Recovery Case for Your SA Credit Provider Portfolio
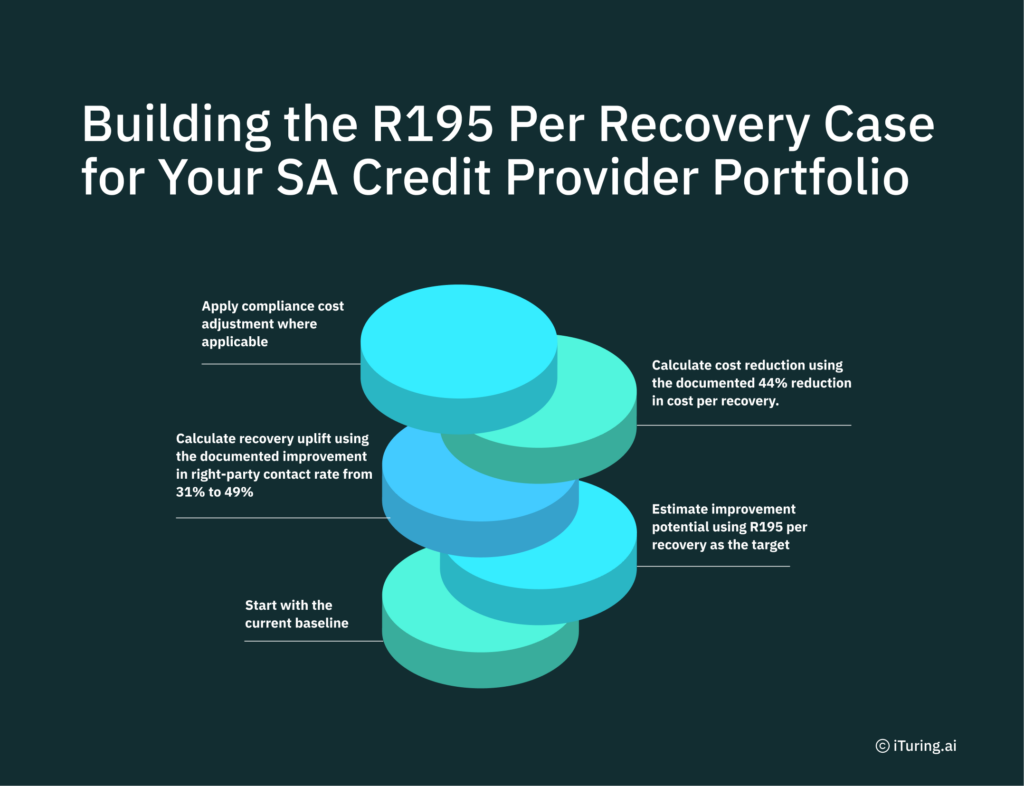
- Start with the current baseline. Establish R420 per recovery as the anchor figure for manual agent operations with NCA compliance overhead included. This number should reflect fully loaded cost: agent salaries, telephony, skip tracing, compliance labour, and technology infrastructure. Do not use a net-of-compliance figure, because the compliance cost is real and persistent. In the current South Africa default rate environment of 2025-2026, this baseline is likely understated for credit providers whose queues have grown faster than headcount, as the effective cost per recovery rises when agents cannot reach all accounts. Higher earners are also struggling with debt obligations, which means even prime portfolios are contributing to collections volume.
- Estimate improvement potential using R195 per recovery as the target. This figure represents the median outcome from AI-first deployments, not the best case. The gap between R420 and R195 is R225 per recovery. Multiply by quarterly collections volume to estimate the gross saving. For a South Africa collections benchmark comparing AI and manual operations in 2025-2026, this gap is the starting point for any credible ROI model.
- Calculate recovery uplift using the documented improvement in right-party contact rate from 31% to 49%. A higher right-party contact rate means more accounts resolved per outbound campaign. For a portfolio of 40,000 delinquent accounts, moving from 31% to 49% right-party contact translates to an additional 7,200 accounts reached per quarter. Apply the portfolio’s average recovery amount to estimate incremental revenue.
- Calculate cost reduction using the documented 44% reduction in cost per recovery. Apply this percentage to the current total collections operations budget, not just agent cost. The 44% figure includes telephony savings, compliance labour reduction, and reduced skip tracing expense. For a credit provider spending R16.8 million quarterly on collections, a 44% reduction produces R7.4 million in quarterly savings.
- Apply compliance cost adjustment where applicable. If the credit provider’s NCA compliance overhead exceeds 18% of total collections operations cost, the compliance cost avoidance from pre-configured AI controls adds incremental ROI beyond the direct cost-per-recovery reduction. Quantify current compliance headcount, audit preparation time, and NCR penalty exposure to build this adjustment.
The calculation only works if the baseline is honest: start with R420 per recovery (manual agent operations with NCA compliance overhead) as the anchor, not an aspirational figure.
Right-Party Contact From 31% to 49%, Cost Reduced 44%: SA Credit Provider Deployment Evidence
A South African credit provider operating in the unsecured personal loan segment faced a R420 per recovery cost baseline, driven by low right-party contact rates, high agent attrition, and manual NCA compliance processes that consumed 20% of operations capacity. The credit provider deployed the iTuring Collections Agent with predictive account prioritisation, multilingual outreach across Zulu, Xhosa, Afrikaans, and Sotho, and pre-configured Section 129 and POPIA compliance controls, with the full deployment completed within 60 days.
SA Collections in 2025-2026: The Default Rate Environment That Makes the AI Investment Case Measurable
The 14.7% consumer delinquency rate, rising NPL ratios, and persistent household over-indebtedness create a collections environment where manual operations face compounding cost pressure with each passing quarter. Credit providers that delay AI collections investment are not maintaining the status quo: they are accepting rising cost per recovery as volume grows and agent capacity remains flat. The CFO case is straightforward: R225 per recovery saved at scale, with compliance cost avoidance as an additional margin, particularly as South Africa’s credit landscape shifts toward greater regulatory scrutiny
iTuring’s SA collections platform has documented right-party contact and cost-per-recovery data from SA credit provider deployments: request a portfolio assessment before any licence decision.